High-Low Breakout Strategy with ATR traling Stop LossThis script is a TradingView Pine Script strategy that implements a High-Low Breakout Strategy with ATR Trailing Stop.created by SK WEALTH GURU, Here’s a breakdown of its key components:
Features and Functionality
Custom Timeframe and High-Low Detection
Allows users to select a custom timeframe (default: 30 minutes) to detect high and low levels.
Tracks the high and low within a user-specified period (e.g., first 30 minutes of the session).
Draws horizontal lines for high and low, persisting for a specified number of days.
Trade Entry Conditions
Long Entry: If the closing price crosses above the recorded high.
Short Entry: If the closing price crosses below the recorded low.
The user can choose to trade Long, Short, or Both.
ATR-Based Trailing Stop & Risk Management
Uses Average True Range (ATR) with a multiplier (default: 3.5) to determine a dynamic trailing stop-loss.
Trades reset daily, ensuring a fresh start each day.
Trade Execution and Partial Profit Taking
Stop-loss: Default at 1% of entry price.
Partial profit: Books 50% of the position at 3% profit.
Max 2 trades per day: If the first trade hits stop-loss, the strategy allows one re-entry.
Intraday Exit Condition
All positions close at 3:15 PM to ensure no overnight risk.
"high low" için komut dosyalarını ara

highs&lowsone of my first strategy: highs&lows
This strategy takes the highest high and the lowest low of a specified timeframe and specified bar count.
It will then takes the average between these two extremes to create a center line.
This creates a range of high middle and low.
Then the strategy takes the current market movement
which is the direct average(no specified timeframe and specified bar count) of the current high and low.
Using this "current market movement" within the range of high middle and low it determins when to buy and then sell the asset.
*********note***************
-this strategy is (bullish)
-works good with most futures assets that have volatility/ decent movement
(might add more details if I forget any)
(work in progress)

Daily HIGH/LOW strategyThis is a DAILY High/LOW strategy combined with a moving average and volume for more accuracy.
The rules are simple :
For long if we had a cross of the high with the previous high and close of the candle is above moving average and chaikin money flow volume is positive we have a long entry.
We exit when we cross down the moving average with the close of the candle.
For short if we had a crossdown of the low with the previous low and close of the candle is below moving average and chaikin money flow volume is negative we have a short entry.
We exit when we cross above the moving average with the close of the candle.
This strategy has no risk management inside so use it with caution.
If you have any questions, let me know


High Low Cloud Strategy BacktestingHigh Low Cloud Strategy Backtesting: this is a breakout and reversal previous trend strategy
A. Indicator: row 6 to row 17
1. Fast Cloud
Upper line = ema of High with 60 periods
Lower line = ema of Low with 60 periods
1. Slow Cloud
Upper line = ema of High with 240 periods
Lower line = ema of Low with 240 periods
B. Strategy Backtesting
1. Chart IDC, Time frame: M30
2. Long condition: row 20 to row 34
a. Entry =
* Upper line of Fast Cloud below Lower line of Slow Cloud
* Price crossover Upper line of Slow Cloud
b. Stoploss =
* Price crossunder bottom of 240 periods (~ bottom of 5 days)
c. Takeprofit =
* Lower line of Fast Cloud above Upper line of Slow Cloud
* Price crossunder Lower line of Fast Cloud
3. Short condition: row 37 to row 49
a. Entry =
* Lower line of Fast Cloud above Upper line of Slow Cloud
* Price crossunder Lower line of Slow Cloud
b. Stoploss =
* Price crossover peak of 240 periods (~ bottom of 5 days)
c. Takeprofit =
* Upper line of Fast Cloud below Lower line of Slow Cloud
* Price crossover Upper line of Fast Cloud

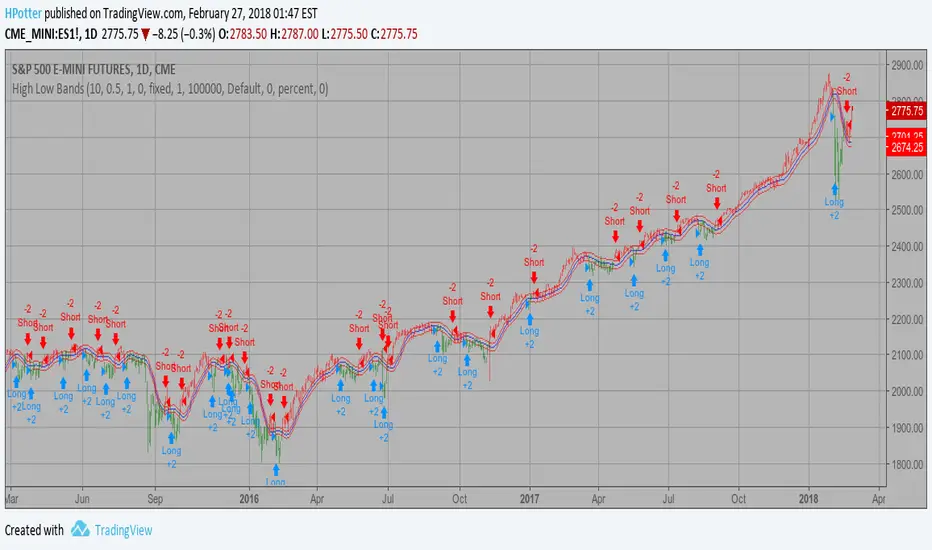
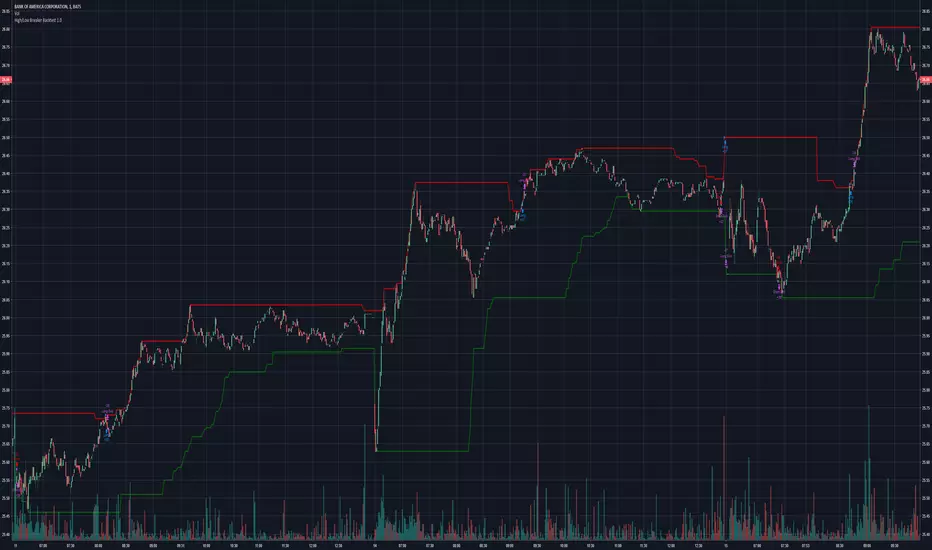
High Low Bands Backtest As the name suggests, High low bands are two bands surrounding the underlying’s
price. These bands are generated from the triangular moving averages calculated
from the underlying’s price. The triangular moving average is, in turn, shifted
up and down by a fixed percentage. The bands, thus formed, are termed as High
low bands. The main theme and concept of High low bands is based upon the triangular
moving average.
You can change long to short in the Input Settings
WARNING:
- For purpose educate only
- This script to change bars colors.
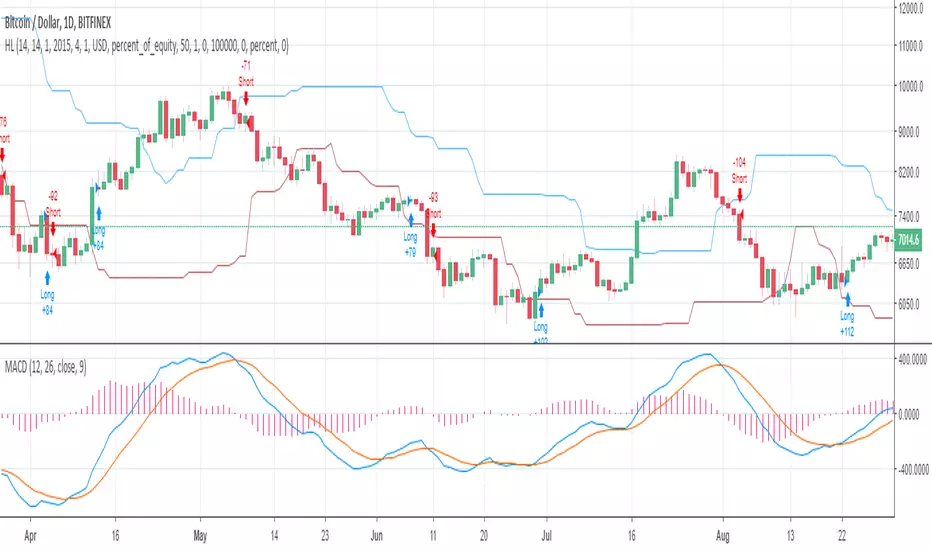
High Low Reversal This bot makes use of an algorithm which detects new highs and lows. When doing long trades, the bot will trigger a buy order on a newly made low. When making shorts, the bot will trigger a short trade on new highs.
Currently, the bot is optimized for cryptocurrencies on the M15 time frame. With the right amount of leverage and portfolio optimization this bot can obtain very strong results.
Feel free to optimize it to your own liking on different assets and/or time frames.
This bot performs exceptionally well in trending markets. Currently, it's only making long trades, but you can make it do short trades in the control panel.
The settings of the back test as follows:
starting capital = 100k
leverage = 1
commission = 0.2%
Equity per trade = 50%. Since the bot only makes one trade at a time you can allow it to use a bigger portion of your balance per trade.
I've also made a study-script for easy implementation on the exchange. You get that script once you get access to this bot.

[Strategy]Turtle's 20day High Low Break StrategyJapanese below / 日本語説明は下記
Overview
I have made this strategy mimicking the legendary traders group, Turtle’s 20days high low break strategy with more options available for take profit(TP) and stop loss(SL) conditions.
The main component of the strategy is same as my indicator, Previous N days/weeks/months high/low(see the link below) and with this strategy, you can backtest previous N days high/low break strategy.
Unlike the indicator, you can specify another previous N days high/low as TP condition. This is because Turtle used 10days low as TP condition for 20days high break buy strategy, according to articles/books about them.
ATR and other factors which is said to be used in their original strategy are not included in this strategy.
Previous N Days/Weeks/Months High Low
What is Turtle?
Turtle is the group of traders founded by Richard Dennis and William Eckhardt to prove their theory that good traders can be trained or not.
It is said that Turtle had made more than 175 million dollars over 5 years and some of the traders has become fund managers or successful individual traders even after the experiment.
What is this strategy like?
The strategy generates long entries once prices break previous N days highs and short entries when previous N days lows broken.
N is user input so you can adjust it for your own strategy.
As mentioned above, you can also specify another set of different previous N days high/low for TP conditions.
e.g. 55 days high(low) break for entry and 20days low(high) break for take profit condition.
How to use it?
What this strategy shows is almost same as the indicator, Previous N days/weeks/months high/low.
It displays previous N days/weeks/months highs and lows and you can set up entry condition based on previous N days high/low.
Previous N weeks/months highs/lows can be used as take profit points when you develop your own strategy based on this.
See the parameters below for the rest of the details.
Parameters
TP condition:
You can select from “Pips”, “When opposite entries” or “Previous high low break”.
When “When opposite entries” selected, the strategy exits the open positions when opposite directional entries happened. e.g. Long positions will be closed when short entries made.
If you would like to exit positions with specific previous N days highs/lows, you can enter N in Previous N days High/Low for TP field with “Previous high low break” selected.
SL condition:
You can select from “Pips” or “Swing High/Low”.
If “Swing High/Low” selected, left bars and right bars need input to determine swing high/low.
Note: If you select “pips” in TP/SL conditions, it currently works only for forex pairs.
What timeframe is the best for this strategy?
As this strategy is for swing trading, longer timeframes are the best.
Base on my quick check upon strategy’s performance over USD pairs in forex, daily timeframe works best, however, it could fit in with lower timeframes such as 4H and 1H by adjusting TP/SL conditions.
Look at the sample result below. The result shows the strategy’s performance for USDJPY for over 40 years on Daily timeframe and it performs fairly good with more than 2 profit factor over long period of time with up-trending equity curve.
It is just a simulation but the data shows Turtle’s strategy still works.
=================
概要
伝説のトレーダー集団タートルの20日高値・安値ブレイク手法を模倣して作成したストラテジーです。
利益確定や損切り条件を設定可能なようにして、より柔軟性を持たせています。
ストラテジーの主要な構造は過去にリリースしたインジケーターPrevious N days/weeks/months high/lowと同じです(下記リンク参照)。
このストラテジーを使うと、過去N日高値・安値のブレイク手法のバックテストを行うことが可能です。
また、前述のインジケーターとは異なり、このストラテジーでは利益確定条件のために、もう一つ別の過去N日高値・安値を設定することができます。これはタートルが20日高値のブレイクで買いエントリーを行う場合、10日安値ブレイクを手仕舞いの基準として使っていたことからです。
タートルのオリジナル手法ではATRやその他の要素も用いられていたようですが、このストラテジーには含まれていません。
Previous N Days/Weeks/Months High Low
タートルとは何か?
タートルとは、「優れたトレーダーは育成可能か?」の問いを証明するために、投資家リチャード・デニス氏とウィリアム・エックハート氏によって組織されたトレーダー集団です。
タートルは5年間に渡って1億7千5百万ドル以上を稼ぎ出したと言われており、この実験終了後にはヘッジファンドを運営する者や個人投資家として成功したトレーダーを輩出したことで知られています。
このストラテジーの特徴
このストラテジーは、価格が過去N日高値をブレイクした時にロングエントリーを、過去N日安値をブレイクした時にショートエントリーを実行します。
Nはパラメーターで指定可能なので、皆さんの独自の手法開発のために調整することができます。
また、前述の通り、利益確定条件としてエントリー条件とは別の過去N日高値・安値を指定することが可能です。
例:エントリーには55日の高値・安値のブレイクを用い、決済には20日高値・安値のブレイクを用いるなど。
使い方
このストラテジーは前述のインジケーターとほぼ同じ内容のラインを表示します。
過去N日、N週間、Nヶ月の高値・安値を表示でき、エントリーの条件として過去N日高値・安値を指定することができます。
過去N週・Nヶ月高値・安値ラインは利益確定の目安に用いるなど、皆さんが独自の手法を構築するときの参考として使ってください。
その他のパラメーターについては以下の詳細を参照ください。
パラメーター:
TP condition(利益確定条件):
“Pips(Pips指定)”, “When opposite entries(逆方向エントリー時)” or “Previous N days high low break(過去N日高値・安値)”から選択することができます。
“When opposite entries” を選択した場合、現在のポジションは、現在ポジションとは逆方向のエントリー条件が満たされた時に、決済されます。
例: ロングポジションはショートのエントリーが実行されると同時に決済される。
特定の過去N日高値・安値ブレイクを決済条件としたい場合は、“Previous N days high low break”を選択の上、該当するN日を”Previous N days High/Low for TP”の項目に入力してください。
SL condition(損切り基準):
“Pips(Pips指定)”、“Swing High/Low(スウィングハイ・ロー)”から選択することができます。
“Swing High/Low”選択時は、高値・安値決定に必要な左右のバーの本数を指定します。
注:TP、SL条件でPipsを選択した場合は、現時点では為替通貨ペアのみに機能します。
このストラテジーに最適の時間軸は?
当ストラテジーはスウィングトレードの手法となっているため、長期の時間軸が適しています。
為替のドルストレートペアでの結果を見てみると日足が最も適していますが、利益確定や損切り条件を調整することで、4時間足や1時間足向きにもアレンジできると思います。
上に示したストラテジーの例は、ドル円の日足における過去40年間以上でのバックテストの結果ですが、これだけの長期に渡って右上がりのエクイティカーブとともにプロフィットファクター2近くを維持するなど、かなり良い結果と言えるのではないでしょうか。
これは一つのシミュレーション結果に過ぎませんが、データを見る限りタートルの手法は現在でも機能すると言えるでしょう。

Average High-Low Range + IBS Reversal Strategy█ STRATEGY DESCRIPTION
The "Average High-Low Range + IBS Reversal Strategy" is a mean-reversion strategy designed to identify potential buying opportunities when the price deviates significantly from its average high-low range and the Internal Bar Strength (IBS) indicates oversold conditions. It enters a long position when specific conditions are met and exits when the price shows strength by exceeding the previous bar's high. This strategy is suitable for use on various timeframes.
█ WHAT IS THE AVERAGE HIGH-LOW RANGE?
The Average High-Low Range is calculated as the Simple Moving Average (SMA) of the difference between the high and low prices over a specified period. It helps identify periods of increased volatility and potential reversal points.
█ WHAT IS INTERNAL BAR STRENGTH (IBS)?
Internal Bar Strength (IBS) is a measure of where the closing price is relative to the high and low of the bar. It is calculated as:
IBS = (Close - Low) / (High - Low)
A low IBS value (e.g., below 0.2) indicates that the close is near the low of the bar, suggesting oversold conditions.
█ SIGNAL GENERATION
1. LONG ENTRY
A Buy Signal is triggered when:
The close price has been below the buy threshold (calculated as `upper - (2.5 * hl_avg)`) for a specified number of consecutive bars (`bars_below_threshold`).
The IBS value is below the specified buy threshold (`ibs_buy_treshold`).
The signal occurs within the specified time window (between `Start Time` and `End Time`).
2. EXIT CONDITION
A Sell Signal is generated when the current closing price exceeds the high of the previous bar (`close > high `). This indicates that the price has shown strength, potentially confirming the reversal and prompting the strategy to exit the position.
█ ADDITIONAL SETTINGS
Length: The lookback period for calculating the average high-low range. Default is 20.
Bars Below Threshold: The number of consecutive bars the price must remain below the buy threshold to trigger a Buy Signal. Default is 2.
IBS Buy Threshold: The IBS value below which a Buy Signal is triggered. Default is 0.2.
Start Time and End Time: The time window during which the strategy is allowed to execute trades.
█ PERFORMANCE OVERVIEW
This strategy is designed for mean-reverting markets and performs best when the price frequently deviates from its average high-low range.
It is sensitive to oversold conditions, as indicated by the IBS, which helps to identify potential reversals.
Backtesting results should be analyzed to optimize the Length, Bars Below Threshold, and IBS Buy Threshold parameters for specific instruments.

STRATEGY Fibonacci Levels with High/Low Criteria - AYNET
Here is an explanation of the Fibonacci Levels Strategy with High/Low Criteria script:
Overview
This strategy combines Fibonacci retracement levels with high/low criteria to generate buy and sell signals based on price crossing specific thresholds. It utilizes higher timeframe (HTF) candlesticks and user-defined lookback periods for high/low levels.
Key Features
Higher Timeframe Integration:
The script calculates the open, high, low, and close values of the higher timeframe (HTF) candlestick.
Users can choose to calculate levels based on the current or the last HTF candle.
Fibonacci Levels:
Fibonacci retracement levels are dynamically calculated based on the HTF candlestick's range (high - low).
Users can customize the levels (0.000, 0.236, 0.382, 0.500, 0.618, 0.786, 1.000).
High/Low Lookback Criteria:
The script evaluates the highest high and lowest low over user-defined lookback periods.
These levels are plotted on the chart for visual reference.
Trade Signals:
Long Signal: Triggered when the close price crosses above both:
The lowest price criteria (lookback period).
The Fibonacci level 3 (default: 0.5).
Short Signal: Triggered when the close price crosses below both:
The highest price criteria (lookback period).
The Fibonacci level 3 (default: 0.5).
Visualization:
Plots Fibonacci levels and high/low criteria on the chart for easy interpretation.
Inputs
Higher Timeframe:
Users can select the timeframe (default: Daily) for the HTF candlestick.
Option to calculate based on the current or last HTF candle.
Lookback Periods:
lowestLookback: Number of bars for the lowest low calculation (default: 20).
highestLookback: Number of bars for the highest high calculation (default: 10).
Fibonacci Levels:
Fully customizable Fibonacci levels ranging from 0.000 to 1.000.
Visualization
Fibonacci Levels:
Plots six customizable Fibonacci levels with distinct colors and transparency.
High/Low Criteria:
Plots the highest and lowest levels based on the lookback periods as reference lines.
Trading Logic
Long Condition:
Price must close above:
The lowest price criteria (lowcriteria).
The Fibonacci level 3 (50% retracement).
Short Condition:
Price must close below:
The highest price criteria (highcriteria).
The Fibonacci level 3 (50% retracement).
Use Case
Trend Reversal Strategy:
Combines Fibonacci retracement with recent high/low criteria to identify potential reversal or breakout points.
Custom Timeframe Analysis:
Incorporates higher timeframe data for multi-timeframe trading strategies.

Fibonacci Levels Strategy with High/Low Criteria-AYNETThis code represents a TradingView strategy that uses Fibonacci levels in conjunction with high/low price criteria over specified lookback periods to determine buy (long) and sell (short) conditions. Below is an explanation of each main part of the code:
Explanation of Key Sections
User Inputs for Higher Time Frame and Candle Settings
Users can select a higher time frame (timeframe) for analysis and specify whether to use the "Current" or "Last" higher time frame (HTF) candle for calculating Fibonacci levels.
The currentlast setting allows flexibility between using real-time or the most recent closed higher time frame candle.
Lookback Periods for High/Low Criteria
Two lookback periods, lowestLookback and highestLookback, allow users to set the number of bars to consider when finding the lowest and highest prices, respectively.
This determines the criteria for entering trades based on how recent highs or lows compare to current prices.
Fibonacci Levels Configuration
Fibonacci levels (0%, 23.6%, 38.2%, 50%, 61.8%, 78.6%, and 100%) are configurable. These are used to calculate price levels between the high and low of the higher time frame candle.
Each level represents a retracement or extension relative to the high/low range of the HTF candle, providing important price levels for decision-making.
HTF Candle Calculation
HTF candle data is calculated based on the higher time frame selected by the user, using the newbar check to reset htfhigh, htflow, and htfopen values.
The values are updated with each new HTF bar or as prices move within the same HTF bar to track the highest high and lowest low accurately.
Set Fibonacci Levels Array
Using the calculated HTF candle's high, low, and open, the Fibonacci levels are computed by interpolating these values according to the user-defined Fibonacci levels.
A fibLevels array stores these computed values.
Plotting Fibonacci Levels
Each Fibonacci level is plotted on the chart with a different color, providing visual indicators for potential support/resistance levels.
High/Low Price Criteria Calculation
The lowest and highest prices over the specified lookback periods (lowestLookback and highestLookback) are calculated and plotted on the chart. These serve as dynamic levels to trigger long or short entries.
Trade Signal Conditions
longCondition: A long (buy) signal is generated when the price crosses above both the lowest price criteria and the 50% Fibonacci level.
shortCondition: A short (sell) signal is generated when the price crosses below both the highest price criteria and the 50% Fibonacci level.
Executing Trades
Based on the longCondition and shortCondition, trades are entered with the strategy.entry() function, using the labels "Long" and "Short" for tracking on the chart.
Strategy Use
This strategy allows traders to utilize Fibonacci retracement levels and recent highs/lows to identify trend continuation or reversal points, potentially providing entry points aligned with larger market structure. Adjusting the lowestLookback and highestLookback along with Fibonacci levels enables a customizable approach to suit different trading styles and market conditions.

Previous Day High Low Strategy only for LongWelcome to the "Previous Day High Low Strategy only for Long"!.
This strategy aims to identify potential long trading opportunities based on the previous day's high and low prices, along with certain market strength conditions.
Key Features:
Entry Conditions: The strategy triggers a long position when the current day's closing price crosses above the previous day's high or low.
Market Strength Filter: The strategy incorporates a market strength filter using the Average Directional Index (ADX). It only takes long positions when the ADX value is above a specific threshold and when there is a predominance of upward movement.
Trade Timing: The strategy operates within a specified trade window, starting at 09:30 and ending at 15:10. Positions are closed at 15:15 if still active.
Risk Management: The strategy employs dynamic stop-loss and profit-taking levels based on a user-defined Max Profit value. It has three profit targets (T1, T2, T3) and a stop-loss level to manage risk effectively.
Rules:
Ensure that the strategy idea is clearly understandable. Provide an easy-to-read title and a thoughtful description explaining the reasoning behind the strategy.
All content should be ad-free. Avoid any form of promotion, advertising, or solicitation.
No fundraising requests or money solicitation is allowed on TradingView.
Publish in the same language as the TradingView subdomain you're on, except for script titles, which must be in English.
Don't plagiarize. Create and share only unique content, and always give credit when using someone else's work.
Be respectful, kind, and constructive when engaging with others.
Zero tolerance for contentious political discourse, defamatory, threatening, or discriminatory remarks.
Avoid sharing harmful, misleading, or inappropriate content.
Respect the moderators' work and address complaints privately.
Use only your original account and avoid creating duplicate or fake accounts.
Do not attempt to manipulate the reputation system or engage in like-for-like schemes.
Explanation of how the strategy works
1. Previous Day's High and Low (HH, LL):
In this strategy, we start by obtaining the high and low prices of the previous day (not the current day) using the request.security function. This function allows us to access historical data for a specific time frame. The high and low prices are stored in the variables HH and LL, respectively.
2. Entry Conditions:
The strategy uses two conditions to trigger a long position:
Condition 1 (Long Condition 1): If the closing price of the current day crosses above the previous day's high (HH), it generates a long signal. This is achieved using the ta.crossover function, which detects when a crossover occurs.
Condition 2 (Long Condition 2): Similarly, if the closing price of the current day crosses above the previous day's low (LL), it also generates a long signal.
Combined Condition: To take long positions, the strategy combines both long conditions using the logical OR operator (or). This means that if either of the two conditions is met, a long position will be initiated.
3. Market Strength Filter:
The strategy also includes a filter based on the Average Directional Index (ADX) to gauge the market's strength before taking long positions. The ADX measures the strength of a trend in the market. The higher the ADX value, the stronger the trend.
Calculation of ADX: The ADX is calculated using the adx function, which takes two parameters: LWdilength (DMI Length) and LWadxlength (ADX period).
Strength Condition (strength_up): The strategy requires that the ADX value should be above a threshold (11 in this case) and that there is a predominance of upward movement (up > down) before initiating a long position. The LWADX value is multiplied by 2.5 and compared to the highest value of LWADX from the last 4 periods using ta.highest(LWADX , 4). If these conditions are met, the variable strength_up is set to true.
Combined Condition: The strength_up condition is then combined with the long conditions using the logical AND operator (and). This means that the strategy will only take a long position if both the long conditions and the market strength condition are met.
4. Trade Timing:
The strategy sets a specific trade window between 09:30 and 15:10. It will only execute trades within this time frame (TradeTime).
5. Risk Management:
The strategy implements dynamic stop-loss (SL) and profit-taking levels (T1, T2, T3) based on a user-defined Max Profit value. The stop-loss is set as a percentage of the Max Profit value. As the position moves in favor of the trader, the profit targets are adjusted accordingly.
6. Position Management:
The strategy uses the strategy.entry function to enter long positions based on the combined entry conditions. Once a position is open, the script uses strategy.exit to define the exit condition when either the profit target or stop-loss level is hit. The strategy.close function is used to close any open position at the end of the trade window (15:15).
7. Plotting:
The strategy uses the plot function to visualize the previous day's high and low prices, as well as the stop-loss (SL) and profit-taking (T1, T2, T3) levels on the chart.
Overall, the "Previous Day High Low Strategy only for Long" aims to identify potential long trading opportunities based on the previous day's price action and market strength conditions. However, as with any trading strategy, it's essential to thoroughly test it and consider risk management before applying it to real-world trading scenarios.
Disclaimer:
The information presented by this strategy is for educational purposes only and should not be considered as investment advice. The strategy is not designed for qualified investors. Always conduct your own research and consult with a financial advisor before making any trading decisions.
Remember, the success of any trading strategy depends on various factors, including market conditions, risk management, and individual trading skills. Past performance is not indicative of future results.

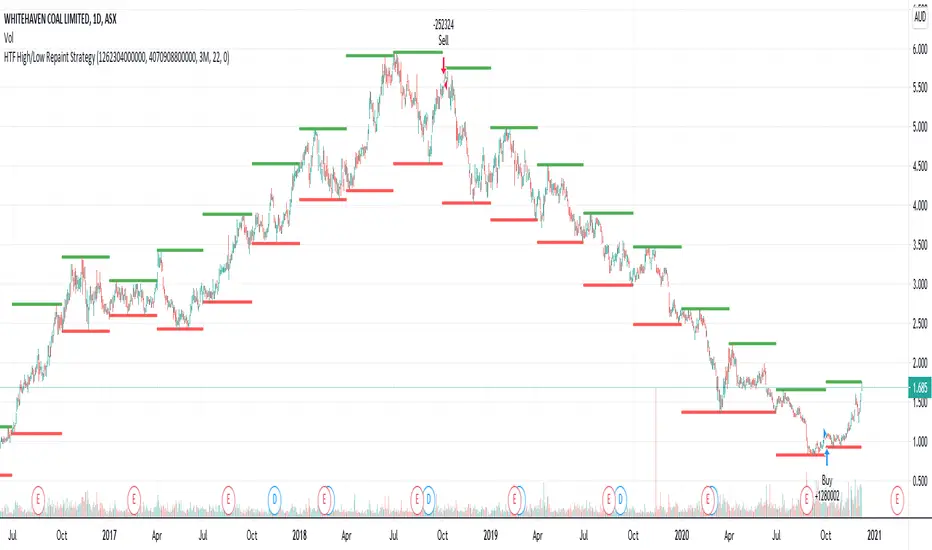
HTF High/Low Repaint StrategyHere is an another attempt to demonstrate repainting and how to avoid them. It happened few times to me that I develop a strategy which is giving immense returns - only to realize after few forward testing that it is repainting. Sometimes, it is well disguised even during forward testing.
In this simple strategy, conditions are as below:
Buy : When a 3M bar produces high and low higher than it's previous 3M bar high, low
Sell : When a 3M bar produces high and low lower than its previous 3M bar high, low.
Default setting is : lookahead = on and offset = 0
This means current 3M bar high low is plotted for all the daily bars within this month. Which means, strategy looks ahead of time to see this 3M bar high is higher than previous 3M bar high during the start of the first daily bar. Hence, this combination leads to massive repaint.
For example, trade made on October 2nd 2018 already knows well ahead of time that price is going to go down in next 3 months:
Similarly, after 2 years on October 2nd 2020 - the strategy already knows that last 3M high is going to be breached on 7th December 2020
Solution: If you are using security for higher timeframes, safer option is always to use offset 1. Further details in the trading view script:
BUT
It may still repaint if we are passing function to security.
For example:
f_secureSecurity(_symbol, _res, _src) => security(_symbol, _res, _src , lookahead = barmerge.lookahead
This function will likely avoid any repainting with Higher timeframe if we are passing in built variables such as high, low, close, open etc. But, if we try to pass supertrend, this will not produce right results. This is because supertrend calculation in turn uses high/low/close values which do not consider the offset while calculating. Hence, even with offset 1, this will still produce issues.
Hence, the call:
= f_secureSecurity(syminfo.tickerid, derivedResolution, supertrend(3,10), offset) will again lead to massive repainting. Solution to this is to implement supertrend function and use high, low, close values derived from secureSecurity.
Quick tips to identify or be suspicious about repainting
Unbelievable results on all timeframes and all instruments with both long and short trades
Lower timeframes giving significantly higher returns on backtest when compared to higher timeframe
If these things happen, be wary about repainting and do a through check of all security function usage in your strategy.
All the best :)
PS: Apply 3-5 days resolution and see the fun. Also, WHC is one hell of a Christmas tree. Could have made immense profit in the same strategy even without repainting.
Larry Connors 3 Day High/Low StrategyThe Larry Connors 3 Day High/Low Strategy is a short-term mean-reversion trading strategy that is designed to identify potential buying opportunities when a security is oversold. This strategy is based on the principles developed by Larry Connors, a well-known trading system developer and author.
Key Strategy Elements:
1. Trend Confirmation: The strategy first confirms that the security is in a long-term uptrend by ensuring that the closing price is above the 200-day moving average (condition1). This rule helps filter trades to align with the longer-term trend.
2. Short-Term Pullback: The strategy looks for a short-term pullback by ensuring that the closing price is below the 5-day moving average (condition2). This identifies potential entry points when the price temporarily moves against the longer-term trend.
3. Three Consecutive Lower Highs and Lows:
• The high and low two days ago are lower than those of the day before (condition3).
• The high and low yesterday are lower than those of two days ago (condition4).
• Today’s high and low are lower than yesterday’s (condition5).
These conditions are used to identify a sequence of declining highs and lows, signaling a short-term pullback or oversold condition in the context of an overall uptrend.
4. Entry and Exit Signals:
• Buy Signal: A buy order is triggered when all the above conditions are met (buyCondition).
• Sell Signal: A sell order is executed when the closing price is above the 5-day moving average (sellCondition), indicating that the pullback might be ending.
Risks of the Strategy
1. Mean Reversion Failure: This strategy relies on the assumption that prices will revert to the mean after a short-term pullback. In strong downtrends or during market crashes, prices may continue to decline, leading to significant losses.
2. Whipsaws and False Signals: The strategy may generate false signals, especially in choppy or sideways markets where the price does not follow a clear trend. This can lead to frequent small losses that can add up over time.
3. Dependence on Historical Patterns: The strategy is based on historical price patterns, which do not always predict future price movements accurately. Sudden market news or economic changes can disrupt the pattern.
4. Lack of Risk Management: The strategy as written does not include stop losses or position sizing rules, which can expose traders to larger-than-expected losses if conditions change rapidly.
About Larry Connors
Larry Connors is a renowned trader, author, and founder of Connors Research and TradingMarkets.com. He is widely recognized for his development of quantitative trading strategies, especially those focusing on short-term mean reversion techniques. Connors has authored several books on trading, including “Short-Term Trading Strategies That Work” and “Street Smarts,” co-authored with Linda Raschke. His strategies are known for their systematic, rules-based approach and have been widely used by traders and investment professionals.
Connors’ research often emphasizes the importance of trading with the trend, managing risk, and using statistically validated techniques to improve trading outcomes. His work has been influential in the field of quantitative trading, providing accessible strategies for traders at various skill levels.
References
1. Connors, L., & Raschke, L. (1995). Street Smarts: High Probability Short-Term Trading Strategies.
2. Connors, L. (2009). Short-Term Trading Strategies That Work.
3. Fama, E. F., & French, K. R. (1988). Permanent and Temporary Components of Stock Prices. Journal of Political Economy, 96(2), 246-273.
This strategy and its variations are popular among traders looking to capitalize on short-term price movements while aligning with longer-term trends. However, like all trading strategies, it requires rigorous backtesting and risk management to ensure its effectiveness under different market conditions.

Top 40 High Low Strategy for SPY, 5minThis strategy is developed based on my High Low Index SPY Top 40 indicator
Notes:
- this strategy is only developed for SPY on the 5 min chart . It seems to work with QQQ as well, but it isn't optimized for it
- P/L shown is based on 10 SPY option contracts, call or put, with strike price closest to the entry SPY price and expiry of 0 to 1 day. This includes commissions (can be changed). This is only an estimate calculated using an arbitrary multiplier factor, this can be changed in the setting
- P/L is based on $5000 initial capital
- Works with both regular / extended trading session turned on/off. However, max drawdown is 1/2 with extended trading session ON
- there is still a bug that doesn't allow alert to be created due to calculation error, will update once fixed
This strategy combines signals from the following indicators to determine entry signals:
- High Low Index SPY Top 40
- MACD
- Linear Regression Slope
Entry signal is triggered when:
- High Low Index line crosses the EMA line
- MACD trending in the same direction
- Linear Regression slope is accelerating above a threshold in the same direction, indicating a strong trend
Profit target(PT) and stop loss(SL) are determined using ATR value, with 2:1 Reward to Risk ratio as default.
Exit signal may be triggered prior to PT or SL trigger when:
- High Low Index SPY Top 40 shows a reversal after overbought or oversold conditions (optional)
- Opposite entry signal is triggered
There are a number of optional settings:
- Turn on/off "option trading", P/L will be calculated using share price only without multiplication factor for trading option contracts
- # of options per trade, default to 10
- Reinvest with profit made
- Trade with trailing SL after PT hit
- Take profit early based on Top 40 overbought/oversold
- Trade 0/1 day expiry. This will signal exit by the end of the day on Mon/Wed/Fri, and only exits 1/2 of positions (if in profit) on Tues/Thurs
- Can reduce the SL level without impacting PT
- No entry between 10:05 - 10:20 (don't ask me why, but statistically it performs better)
Consider donating me some of your profit if you make $$$ hahaha~ ;)
Enjoy~~

IU open equal to high/low strategyIU open equal to high/low strategy:
The "IU Open Equal to High/Low Strategy" is designed to identify and trade specific market conditions where the day's first price action shows a strong directional bias. This strategy automatically enters trades based on the relationship between the market's open price and its first high or low of the day.
Entry Conditions:
1. Long Entry: A long position is initiated when the first open price of the session equals the day's first low. This signals a potential upward move.
2. Short Entry: A short position is initiated when the first open price of the session equals the day's first high. This signals a potential downward move.
Exit Conditions:
1. Stop Loss (SL): For both long and short trades, the stop loss is calculated based on the low or high of the candle where the position was entered.
2. Take Profit (TP): The take profit is set using a Risk-to-Reward (RTR) ratio, which is customizable by the user. The TP is calculated relative to the entry price and the distance between the entry and the stop loss.
Additional Features:
- Plots are used to visualize the entry price, stop loss, and take profit levels directly on the chart, providing clear and actionable insights.
- Labels are displayed to indicate the occurrence of the "Open == Low" or "Open == High" conditions for easier identification of potential trade setups.
- A dynamic fill highlights the areas between the entry price and the stop loss or take profit, offering a clear visual representation of the trade's risk and reward zones.
This strategy is designed for traders looking to capitalize on directional momentum at the start of the trading session. It is customizable, allowing users to set their desired Risk-to-Reward ratio and tailor the strategy to fit their trading style.

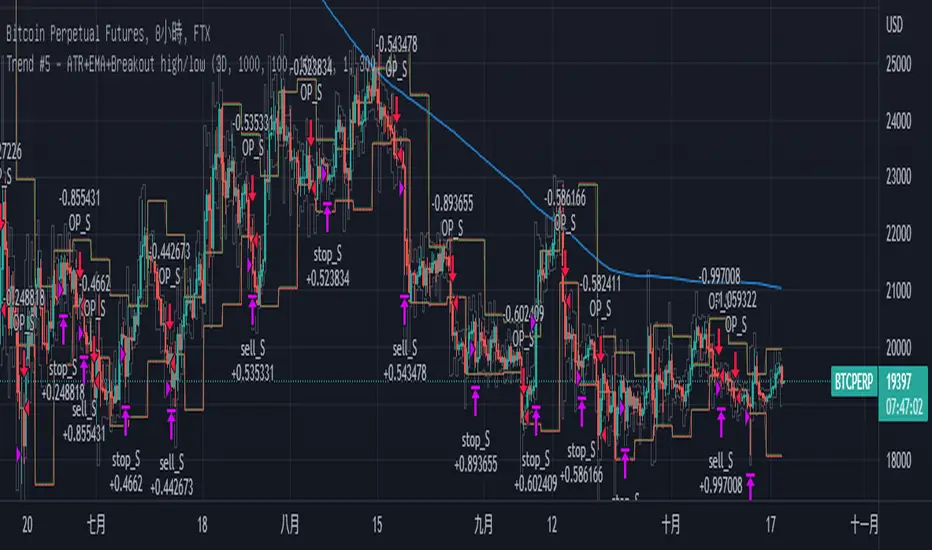
Trend Breakout high/low #1What is the Trend Breakout high/low #1?
This script uses the high/low of each fixed time period as a conditional judgment, and when the high/low is broken as a buy/sell signal, trying to capture a trend.
How to use this script?
Start date and Stop date: You can choose the date of the test.
Trading cycle: Selected time period is used as the basis for determining the high/low and is limited to one trade only.
Stop range: This value will calculate the stop loss range. Set 50-100 that is better
Fixed mode: Fixed of lots per transaction.
---Additional Functions---
Reversal mode: Reversing the buy and sell signals, may be useful in certain situations.
Wighted mode: Increased profitability under certain conditions
When win & When lose:Judgment when there is an ongoing loss/profit as a condition, may be useful in certain situations.
Use closing price: Use the closing price breakout high/low as a conditional judgment, but this function sometimes fails.
Notes:
Trading cycle and your chart time period can't be set too close,that will result repainting.
Stop range can't be set too small,that will result repainting either.
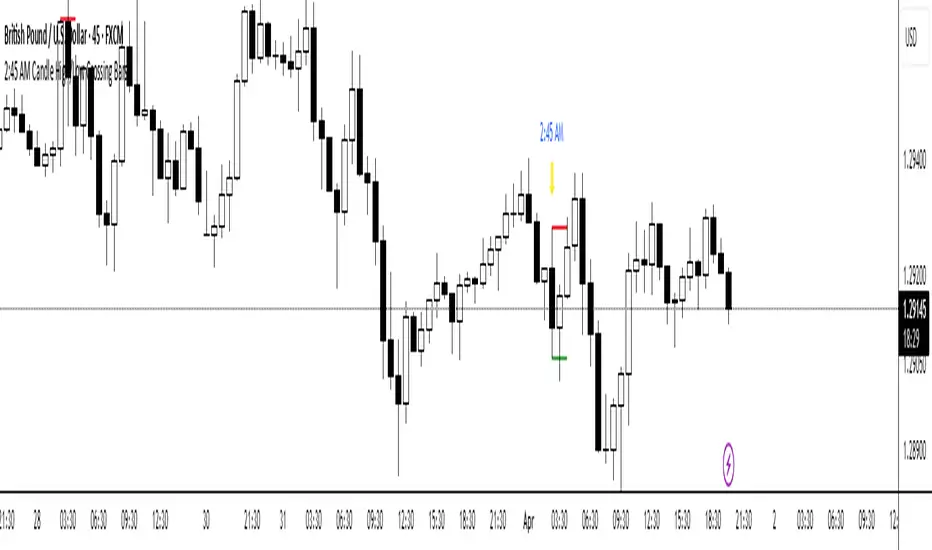
Same high/lowIf you are using support/resistance level-based strategies in your trading then this indicator can help you. I think that the retest level strategy is the best for beginners due to its simplicity of risk/reward calculations and higher abundance on the market. There is a well-known method to recognize a big player (buyer/seller) by candlestick pattern where the last two candles have the same low or same high. Moreover, abnormal candles increase the probability of a retest of a strong level, so my indicator highlights these two situations. In my opinion, a higher timeframe of a candle chart increases the win rate for this indicator (>1h).
So there are several patterns which my indicator can recognize:
1. Same low/high: blue flag up - same low, blue flag down - same high.
2. Mirror levels: high-low - green flag up, low-high - green flag down.
3. abnormal candles: yellow body if >2*ATR (please tune atr in properties, the default value is 5).
4. The red flag indicates the third candle with the same high/low in a row.
Thanks for your attention and have a good trading time!

Delta SMA 1-Year High/Low Strategy### Summary:
This Pine Script code implements a trading strategy based on the **Delta SMA (Simple Moving Average)** of buy and sell volumes over a 1-year lookback period. The strategy identifies potential buy and sell signals by analyzing the relationship between the Delta SMA and its historical high/low thresholds. Key features include:
1. **Delta Calculation**:
- The Delta is calculated as the difference between buy volume (when close > open) and sell volume (when close < open).
- A 14-period SMA is applied to the Delta to smooth the data.
2. **1-Year High/Low Thresholds**:
- The strategy calculates the 1-year high and low of the Delta SMA.
- Buy and sell conditions are derived from thresholds set at 70% of the 1-year low and 90% and 50% of the 1-year high, respectively.
3. **Buy Condition**:
- A buy signal is triggered when the Delta SMA crosses above 0 after being below 70% of the 1-year low.
4. **Sell Condition**:
- A sell signal is triggered when the Delta SMA drops below 60% of the 1-year high after crossing above 90% of the 1-year high.
5. **Visualization**:
- The Delta SMA and its thresholds are plotted on the chart for easy monitoring.
- Optional buy/sell signals can be plotted as labels on the chart.
This strategy is designed to capture trends in volume-based momentum over a long-term horizon, making it suitable for swing or position trading.

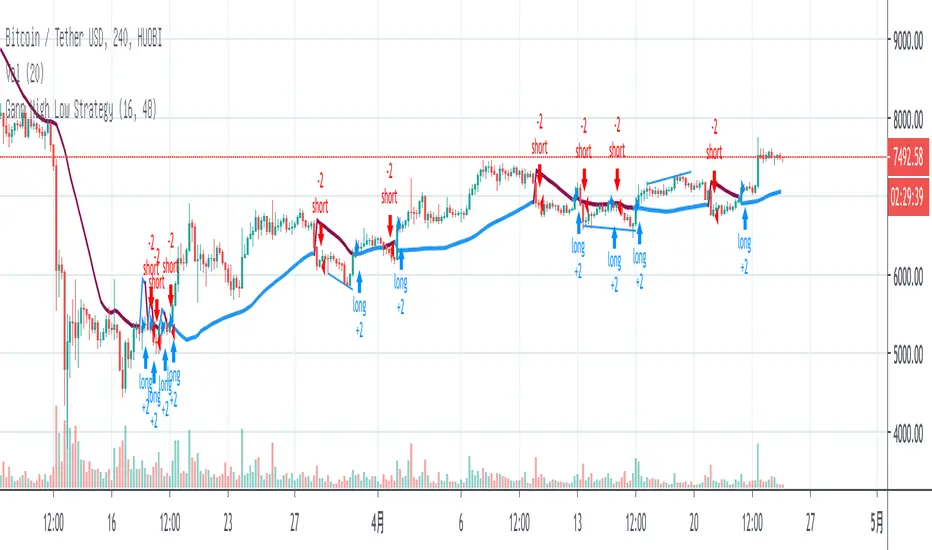
Gann High Low StrategyGann High Low is a moving average based trend indicator consisting of two different simple moving averages.
The Gann High Low Activator Indicator was described by Robert Krausz in a 1998 issue of Stocks & Commodities Magazine. It is a simple moving average SMA of the previous n period's highs or lows.
The indicator tracks both curves (of the highs and the lows). The close of the bar defines which of the two gets plotted.
2:45 AM Candle High/Low Crossing Bars2:45 AM Candle High/Low Crossing Bars is an indicator that focuses on the trading view 2:45am NY TIME high and low indicating green for buy and red bars for sell, with the 2:45am new york time highlight/ If the next candle sweeps the low we buy while if it sweeps the high we sell, all time zoon must be the new York UTC time.